Booster characterization
Booster
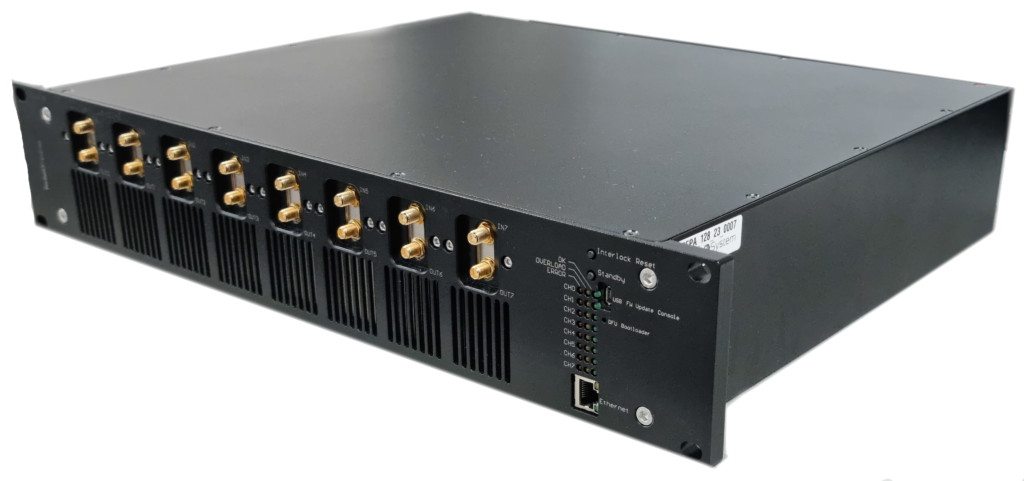
Booster is a 8 channel RF amplifier allowing for up to 40dBm of output power with bandwidth from 50MHz to 500MHz
In this article we will conduct the most important measurements and present them here.
The following measurements were done on the high efficiency variant of the channels and release v1.6.(All channels were calibrated at 50mA)
Gain
Starting off with the most interesting figure the gain.
- Spectrum Analyzer – N9322C
- Signal Generator – N5171B
- Shielded SMA cables -50Ohm 50cm
- Attenuator – 20dB 20W
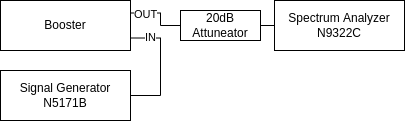
We want to get the S21 parameter of not the entire measurement track (attenuator, wires…) but only booster’s. In order to do that the first thing we have to calibrate out the unwanted attenuation in the track. Namely we disconnect the booster and short the wires normally connected to it resulting in:

Then we measure the attenuation:
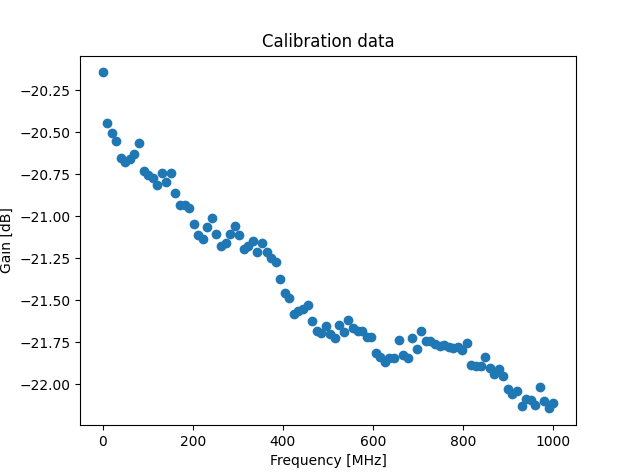
100 points were measured in range from 50kHz to 1GHz. I consider this sufficient. Later if we need the attenuation for a frequency not measured here, we interpolate these values.
The result:
- Green line @-10dBm input power
- Orange line @-20dBm input power
- Blue line @-30dBm input power
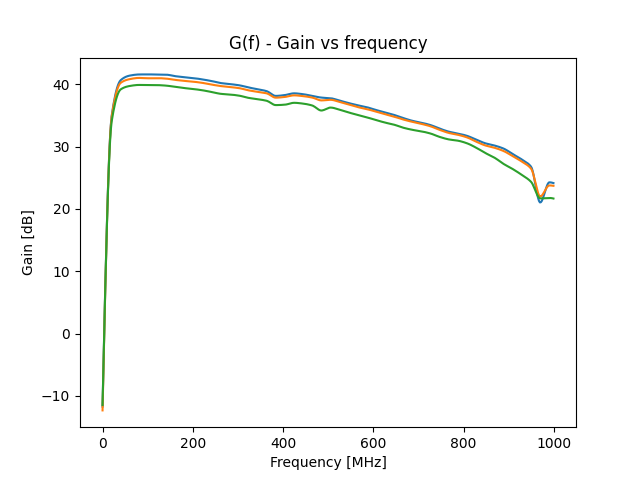
- Peak gain at about 41.5dB
- -3dB Bandwidth: 35MHz -370MHz
This results in a somewhat lower bandwidth then advertised, but there is still plenty of gain even above 500MHz
Maximum output power (P1dB)
Next let’s see how much power we can actually get out of the device. We will do this by sweeping the input power at a fixed frequency and monitoring the output power.
This measurement required two calibrations. Firstly, the power at the input is not really the power at the signal generator. It’s attenuated by the cable. The same thing goes for the output to the spectrum analyser. In the gain measurement we cared only about one quantity, so we didn’t do the calibration separately.
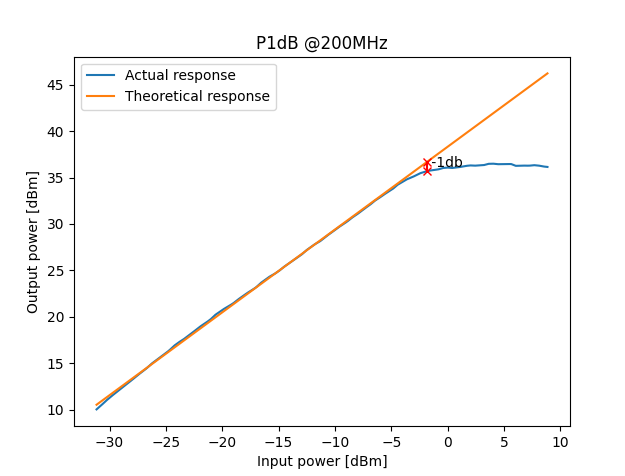
- P1dB IN: -1.84 dBm
- P1dB OUT: 35.68 dBm
- Power output at saturation : 36dBm
- Power input at saturation : 3dBm
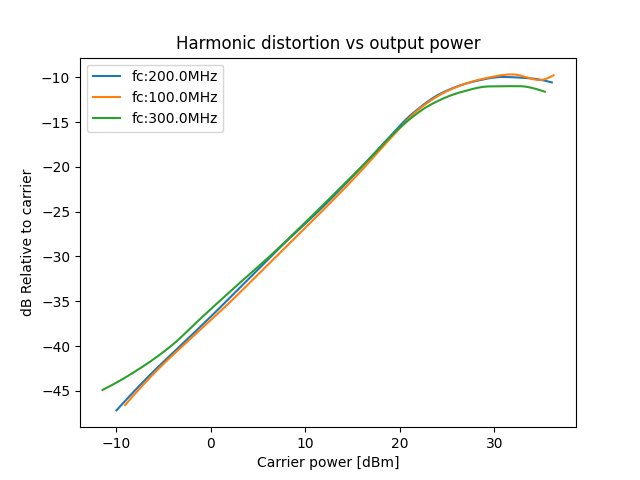
Harmonic distortion
Booster’s channels come in two variants as mentioned earlier HE aka. High Efficiency and HL aka. High Linearity. Harmonic distortion refers to the unwanted generation of frequency components that are integer multiples of the input signal frequency. This occurs when the amplifier’s output doesn’t perfectly replicate the input waveform due to non-linearities in the amplifier’s response. For the setup refer to the one presented in the Gain section. This time we cared only about the output power, so the track from the output of the device to the spectrum analyser was calibrated out.
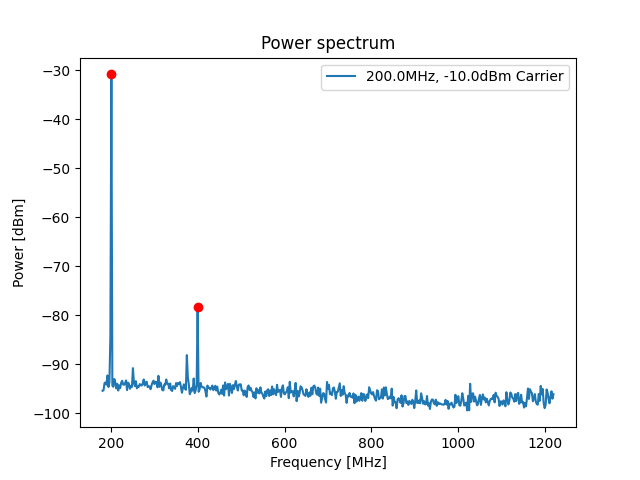
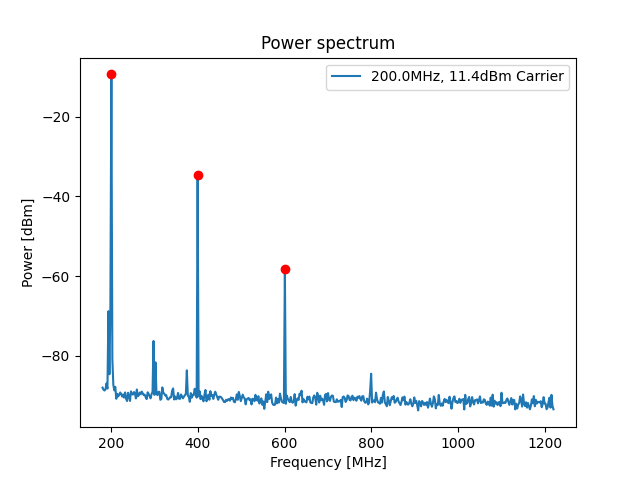
Below is a formula by which the harmonic distortion is evaluated. It’s the ratio of the carrier signal power to the power of all of it’s harmonics.
\[10\times log_{10}(\frac{P0}{P1+P2+…Pn})\]As seen on the spectrums above harmonic contents gets worse the greater the output power.
When plotting it on a graph:
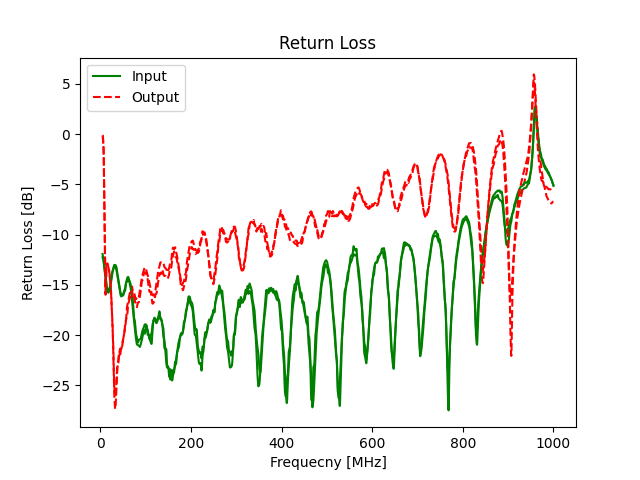
Return loss S22 S11
Return loss is a measure of how much power is reflected back from a device compared to the incident power. It indicates how well the impedance of a device matches the characteristic impedance of the transmission line or system it’s connected to.
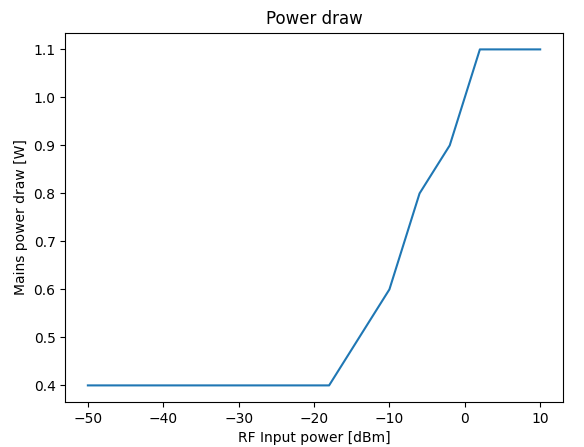
Power draw
We also measured the power drawn by the booster from mains. It was done on a UNI-T UT71E Multimeter.
When all the channels are off the readout is about 0.2W. When we turn on one channel we get: